Close Menu
Terrain News
  • Environmental Science
  • Landforms & Habitats
  • Extreme Events
  • Watershed Restoration
  • Wildfire
What's Hot

Record-Breaking Wildfires Persist Throughout the Season

Coastal Treasures: Exploring the Fun of Beach Scraping

Explore Nature: Free Biking and Hiking Workshops in September at The Watershed Center

Facebook X (Twitter) Instagram
Facebook X (Twitter) Instagram Pinterest
Terrain News
TerrainWorks
  • Environmental Science
  • Landforms & Habitats
  • Extreme Events
  • Watershed Restoration
  • Wildfire
Terrain News
You are at:Home»Extreme Climate & Geophysical Events»Climate Shifts in Southeastern Oromia: Analyzing Extreme Rainfall and Temperature Trends
Extreme Climate & Geophysical Events

Climate Shifts in Southeastern Oromia: Analyzing Extreme Rainfall and Temperature Trends

Terrain NewsBy Terrain NewsAugust 15, 2025002 Mins Read
Share Facebook Twitter Pinterest LinkedIn Tumblr Email
Climate Shifts In Southeastern Oromia: Analyzing Extreme Rainfall And Temperature
Share
Facebook Twitter LinkedIn Pinterest Email

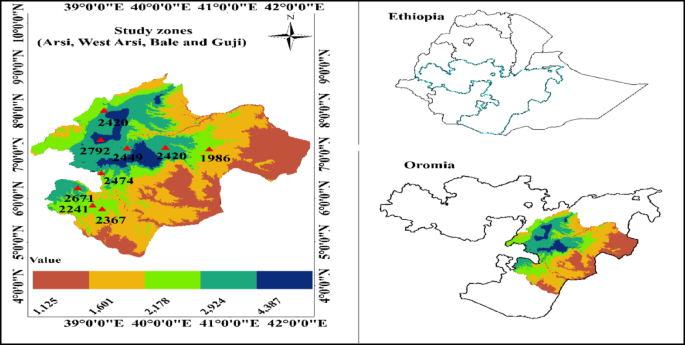
The article analyzes the descriptive statistics of agroclimatic extremes related to rainfall and temperature across nine meteorological stations in southeastern Oromia, Ethiopia, over a 30-year period (1994-2023).

Key Findings:

  1. Precipitation Extremes:

    • Consecutive Dry Days (CDD): Average of 52 days/year with significant variation among stations. Areas such as Ginir and Asela exhibit higher CDD (58-61 days), while Bore has fewer (44-46 days). Variability attributed to topography and climate change.
    • Consecutive Wet Days (CWD): Average of 16 days/year, with fluctuations noted; Agarfa showed the minimum and Bokoji the maximum.
    • Rainfall Intensity (SDII): Average of 7.1 mm/day/year with considerable variability. Highest recorded at Adola (9.0 mm) and lowest at Sinana (5.3 mm).
    • Heavy Rainfall Days: Average of 27 days/year for precipitation exceeding 10 mm, varying greatly by region (17 at Sinana to 40 at Bore).
  2. Temperature Extremes:

    • Cool Nights (TN10P): Average of 11% (~40 days/year) indicating low variability. Areas like Adola had fewer cool nights.
    • Warm Nights (TN90P): Average of 10.9% with consistent upward trends; districts like Ginir and Dodola showed positive trends.
    • Daily Maximum Temperature (TXx): What appears to be a warming trend, with notable increases across most stations.
  3. Temporal Trends:

    • Overall, 33.3% of stations showed increasing trends in total wet-day rainfall (PRCPTOT), with some stations experiencing significant decreases, indicating rising water security challenges. Mixed trends exist for very wet days (R95P and R99P) across different stations, suggesting divergent local climatic influences.
    • Extreme Temperature Trends: Nearly all stations indicate a warming trend, particularly for warm day and night indicators, contrasting with declines in cool temperature metrics.
  4. Conclusions:
    • A complex interaction between local climate variability, topography, and meteorological patterns impacts farming, water management, and regional planning.
    • The results underscore the necessity for localized adaptation strategies to mitigate the adverse effects of these climatic changes on agriculture and ecosystems.

This comprehensive analysis highlights the urgent need for attention to climate impacts in southeastern Oromia amid evolving agroclimatic conditions.

Source link

Analyzing Climate Extreme Oromia Rainfall Shifts Southeastern Temperature Trends
Share. Facebook Twitter Pinterest LinkedIn Tumblr Email
Previous ArticleReviving the Paulins Kill River
Next Article Surveying Community Insights for Runyon Creek Restoration Plan
leebenda
Terrain News
  • Website

Related Posts

Vermont’s Growing Wildfire Smoke: The Impact of Climate Change

August 21, 2025

Lancaster County’s Rainfall Challenges Stormwater and Watershed Restoration Efforts

August 5, 2025

Exploring the Rise of Natural Disasters

July 23, 2025
Top Posts

Harnessing Machine Learning to Enhance Extreme Weather Alerts

January 8, 202515 Views

Understanding Extreme Weather: The Link to the Climate Crisis

January 8, 202515 Views

Human Influence on Our Landscapes

January 8, 202514 Views
Stay In Touch
  • Facebook
  • YouTube
  • TikTok
  • WhatsApp
  • Twitter
  • Instagram
Most Popular

Harnessing Machine Learning to Enhance Extreme Weather Alerts

January 8, 202515 Views

Understanding Extreme Weather: The Link to the Climate Crisis

January 8, 202515 Views

Human Influence on Our Landscapes

January 8, 202514 Views
Don't Miss

Record-Breaking Wildfires Persist Throughout the Season

Coastal Treasures: Exploring the Fun of Beach Scraping

Explore Nature: Free Biking and Hiking Workshops in September at The Watershed Center

Popular This Week

Connecting Nature, Science, and Spirit on Aquidneck Island Walks

Greenland’s Ice Meltdown: A 600 Billion Ton Loss in Just One Year

India’s Relentless Struggles: A Year of Daily Disasters

© 2025 Terrain News. All Rights Reserved.
  • About Us
  • Privacy Policy
  • Terms and Conditions
  • Disclaimer

Type above and press Enter to search. Press Esc to cancel.